Observational Health & Patient-Level Prediction
What is Observational Health Research?
Most of what we know about how diseases progress, how drugs interact, and what puts patients at risk comes not from controlled trials - but from observing what actually happens to real patients over time.
Observational health research uses data that is routinely collected during patient care: electronic health records, prescription databases, insurance claims, disease registries. Unlike a clinical trial, no intervention is imposed. Instead, researchers ask questions about patterns that emerge naturally across large populations.
This kind of research is invaluable precisely where trials cannot go - studying rare diseases, long-term outcomes, vulnerable populations, or the effects of treatments already in clinical use.
Why Phenotypes Matter
To study any patient group, you first need to define it precisely. A phenotype definition is a formal, reproducible specification of which patients belong to a group - written in terms of clinical data actually present in the record (diagnosis codes, medications, lab results, dates).
A well-crafted phenotype is the foundation of any valid study. If the definition includes the wrong patients, or excludes the right ones, every downstream result is compromised. Phenotype definitions should be:
Explicit - unambiguous criteria, written in a computable form
Reproducible - the same definition run on any OMOP-formatted database should yield a comparable cohort
Validated - ideally reviewed by a clinician familiar with the condition
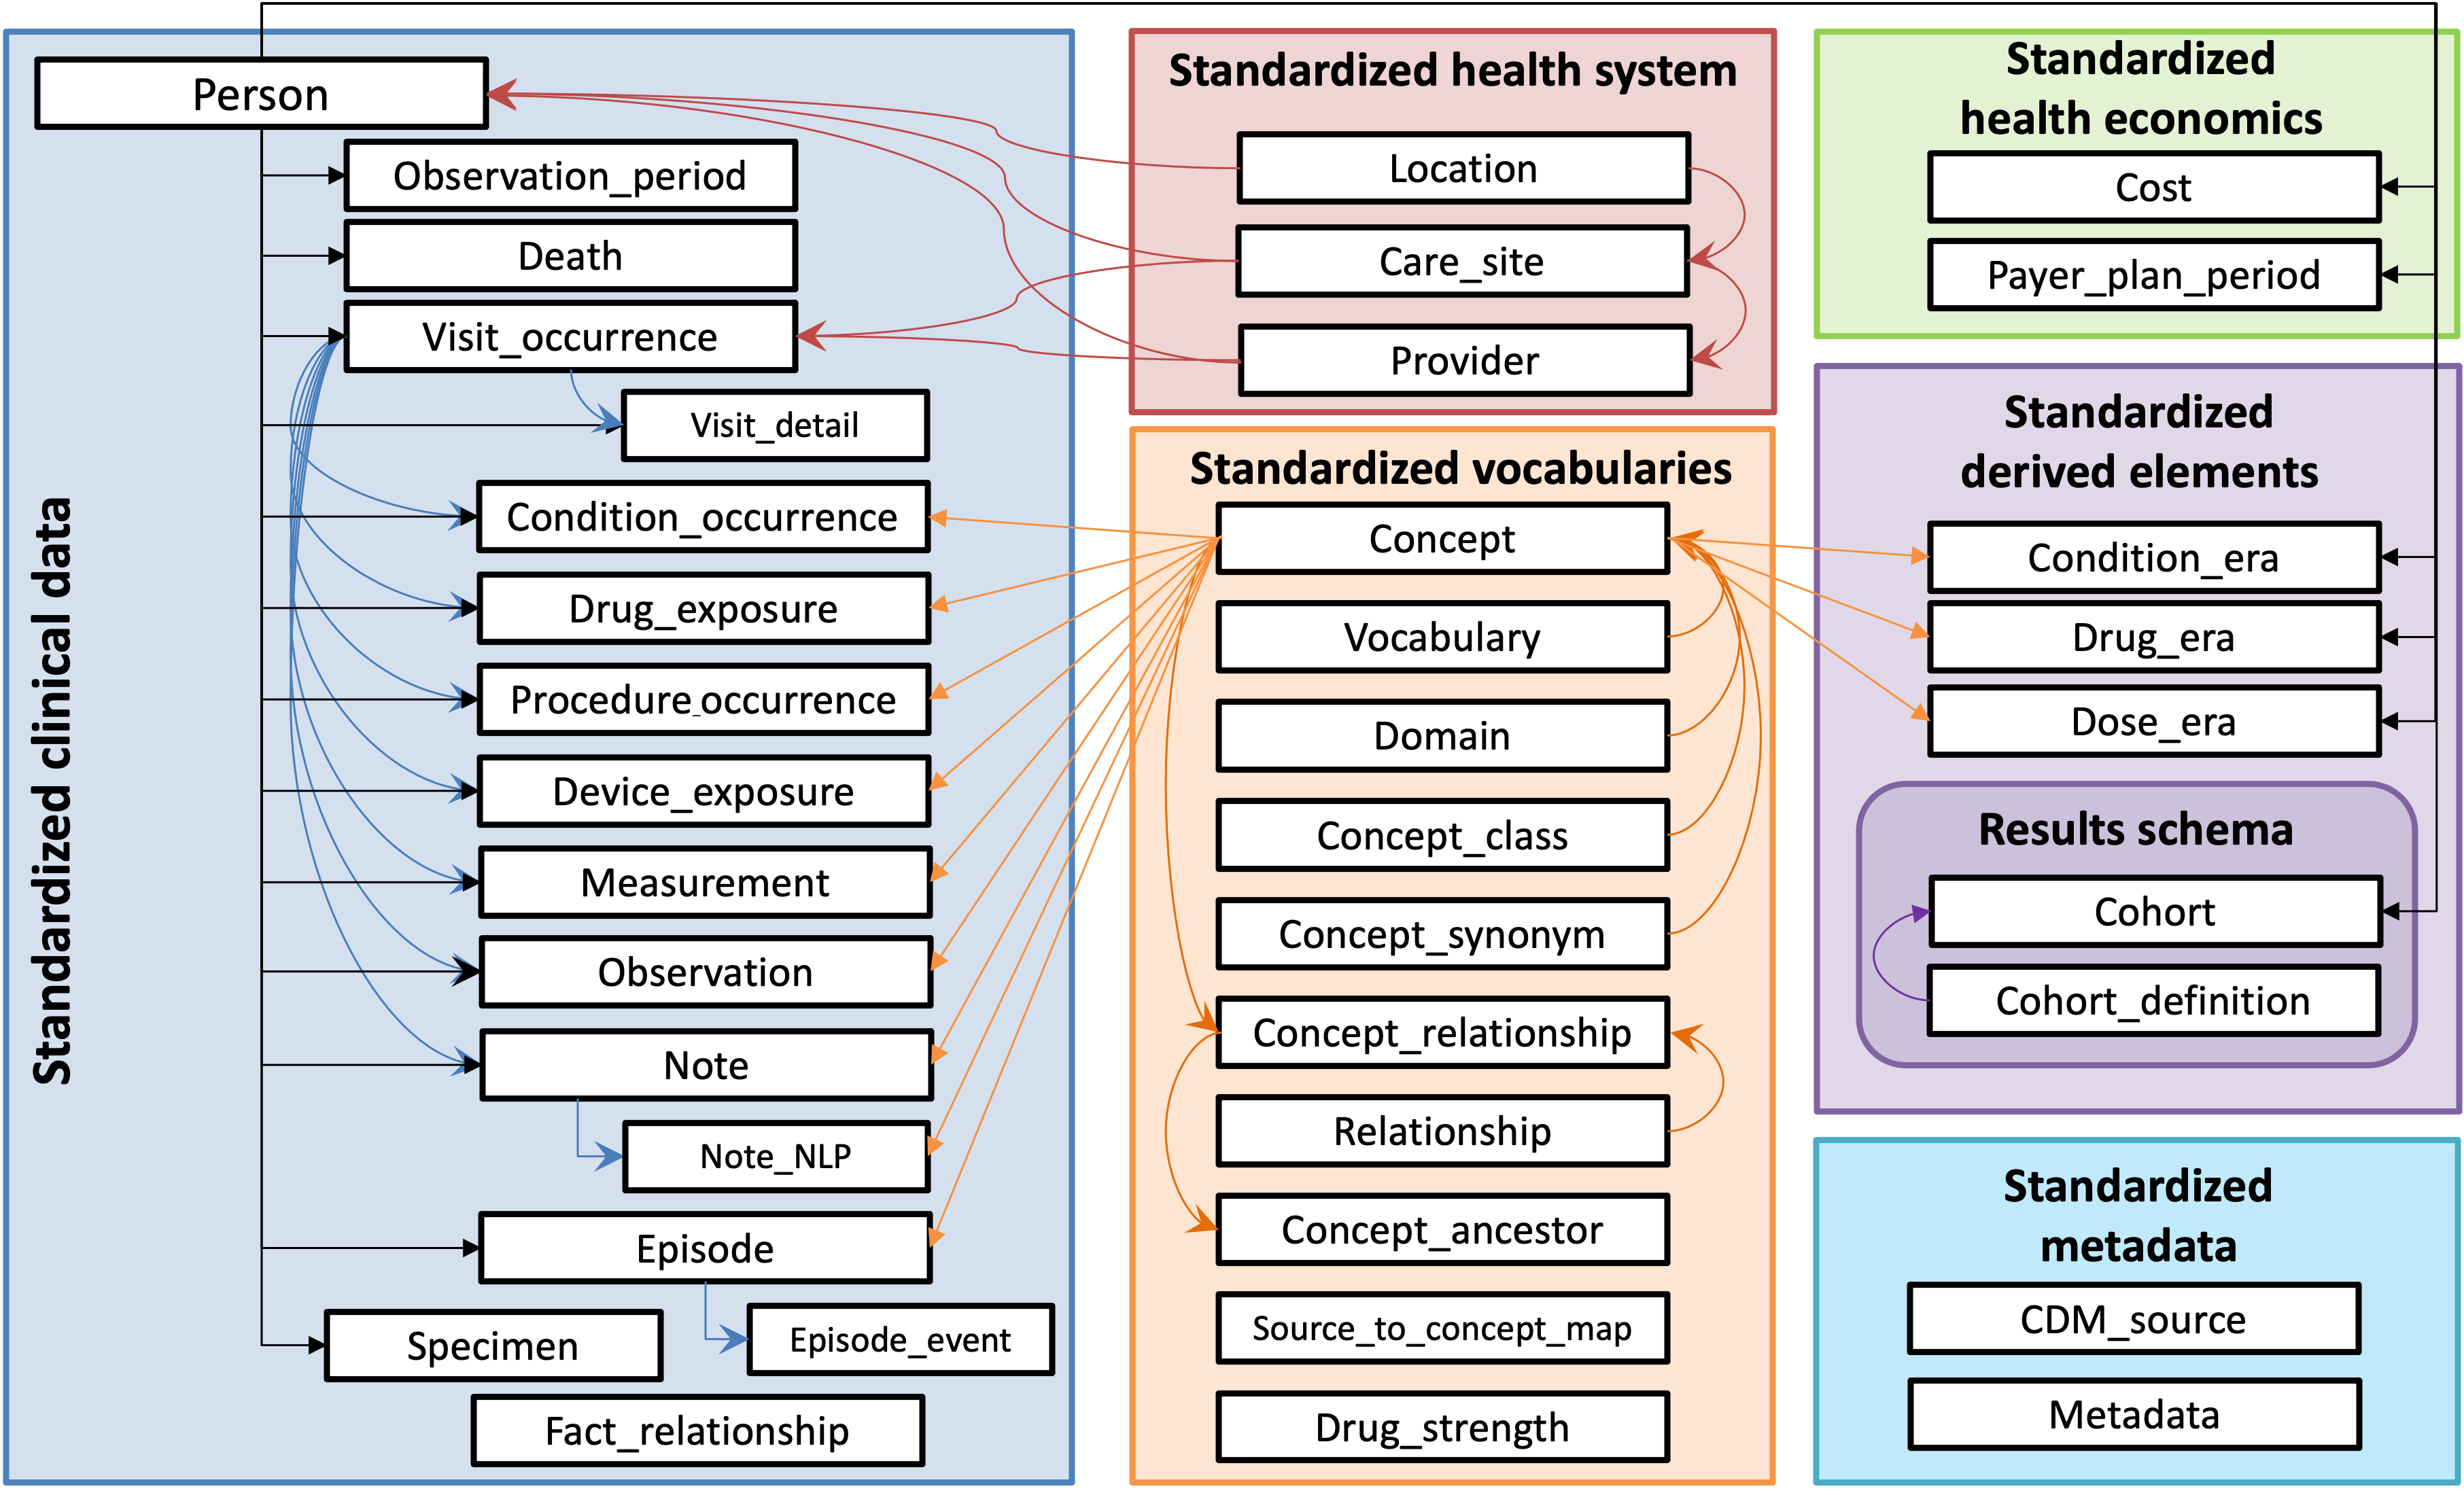
The OMOP Common Data Model
The OMOP Common Data Model (CDM) is an international standard for organizing observational health data. Different hospitals, insurers, and registries store their data in different formats and terminologies - OMOP normalizes them all into a single, shared schema.
This standardization is what makes federated research possible: the same analysis, running on OMOP databases at institutions across different countries, produces comparable results without any patient data leaving the institution.
The key OMOP tables you will encounter in this workflow are:
| Table | What it contains |
|---|---|
person | One row per patient - age, gender, race, ethnicity |
condition_occurrence | Every recorded diagnosis, with start and end dates |
drug_exposure | Every prescribed or dispensed medication |
procedure_occurrence | Procedures performed on the patient |
measurement | Lab values, vitals, and other quantitative observations |
observation | Clinical observations that don't fit other categories |
visit_occurrence | Healthcare visits - inpatient, outpatient, emergency |
All clinical concepts are represented as numeric IDs from the OMOP vocabulary - conditions as SNOMED codes, drugs as RxNorm, measurements as LOINC - giving every study a shared, unambiguous language.
Patient-Level Prediction
Patient-Level Prediction (PLP) asks a specific kind of question: for this individual patient, how likely is it that a particular event will occur in the future?
Unlike population-level statistics that describe averages and associations, PLP makes individual-level probability estimates. These are actionable - a high predicted risk can trigger a clinical alert, re-schedule a follow-up, or enroll a patient in a prevention program.
The OHDSI PLP framework (Reps et al., 2018) defines a rigorous, standardized design:
Target cohort - the population you want to make predictions for (e.g., every patient with a new hypertension diagnosis)
Outcome cohort - the future event you want to predict (e.g., pneumonia onset within 12 months)
Index date - each patient's cohort entry date; features are extracted before this date, outcomes are labeled after
Lookback window - how far back in history to extract features (typically 365 days)
Time-at-risk window - how far forward to look for the outcome (e.g., 0 to 365 days after index)
This temporal design is what prevents data leakage - we only ever use a patient's past to predict their future.
Reps, J. M., Schuemie, M. J., Suchard, M. A., Ryan, P. B., Rijnbeek, P. R., & Madigan, D. (2018). Design and implementation of a standardized framework to generate and evaluate patient-level prediction models using observational healthcare data. JAMIA, 25(8), 969–975. https://doi.org/10.1093/jamia/ocy032
Research Question
Among patients with hypertension, who will develop pneumonia within the next year?
Hypertension is a common comorbidity that can increase susceptibility to respiratory infections. Patients with cardiovascular conditions may have compromised immune responses or other risk factors that make them more vulnerable to pneumonia. Early identification of high-risk individuals could enable preventive interventions such as vaccination, closer monitoring, or early treatment protocols.
In OHDSI terms:
Target cohort - patients with a first recorded hypertension diagnosis (index date = first diagnosis)
Outcome cohort - patients from the target cohort who receive a pneumonia diagnosis within 365 days of their index date
Prediction - for each patient at their index date, estimate the probability of the outcome occurring
This is the question the rest of this workflow answers - in Julia, end to end.
Ready to run it? Head to the PLP Workflow for a step-by-step walkthrough of the full pipeline, or see the Package Examples for focused, runnable demos of each JuliaHealth package.