PLP-Pipeline Series Part 1: From Research Question to Cohort Construction
Introduction 👋
Hi everyone! I’m Kosuri Lakshmi Indu, a third-year undergraduate student in Computer Science and an aspiring GSoC 2025 contributor. My interest in using data science for public health led me to the JuliaHealth community and, under the mentorship of Jacob S. Zelko, I began working on a project titled PLP-Pipeline. This project focuses on building modular, efficient tooling for Patient-Level Prediction (PLP) entirely in Julia, using the OMOP Common Data Model (OMOP CDM).
In this post, I’ll walk through the first part of a three-part blog series documenting my work on building a Patient-Level Prediction (PLP) pipeline in Julia. Each post focuses on a different stage of the pipeline:
From Research Question to Cohort Construction (this post)
From Raw Clinical Data to Predictive Models
Lessons Learned, Key Challenges, and What Comes Next
In Part 1, we’ll start at the very beginning-formulating the research question, exploring the OMOP CDM, setting up the local database, and defining target and outcome cohorts using Julia tools. Whether you’re a health researcher, a GSoC aspirant, or a Julia enthusiast, I hope this gives you a clear and accessible introduction to how observational health research can be made more composable, reproducible, and efficient using Julia.
You can find my PLP-Pipeline Project Link Here
Background
What is Observational Health?
Observational health research examines real-world patient data such as electronic health records (EHRs), claims, and registries to understand health and disease outside of controlled trial environments. This type of research plays a vital role in informing decisions by clinicians, policymakers, and researchers, especially when addressing population-level health questions and disparities.
A core aspect of observational health is the use of phenotype definitions, which describe a specific set of observable patient characteristics (e.g., diagnosis codes, symptoms, demographics, biomarkers) that define a population of interest. Creating accurate and reproducible phenotype definitions is essential for ensuring research validity. However, challenges such as missing data, demographic biases, and inconsistently recorded information can significantly impact the reliability of these definitions.
To support reproducible research at scale, communities like OHDSI (Observational Health Data Sciences and Informatics) have developed standards such as the OMOP Common Data Model (CDM) and workflows for developing computable phenotype definitions.
In our work, we utilize observational health data already structured through the OMOP Common Data Model (CDM). We construct patient cohorts based on existing phenotype definitions. These cohorts then serve as the basis for building patient-level prediction models, enabling us to explore and generate insights that can support data-driven clinical decision-making.
What Is the OMOP CDM?
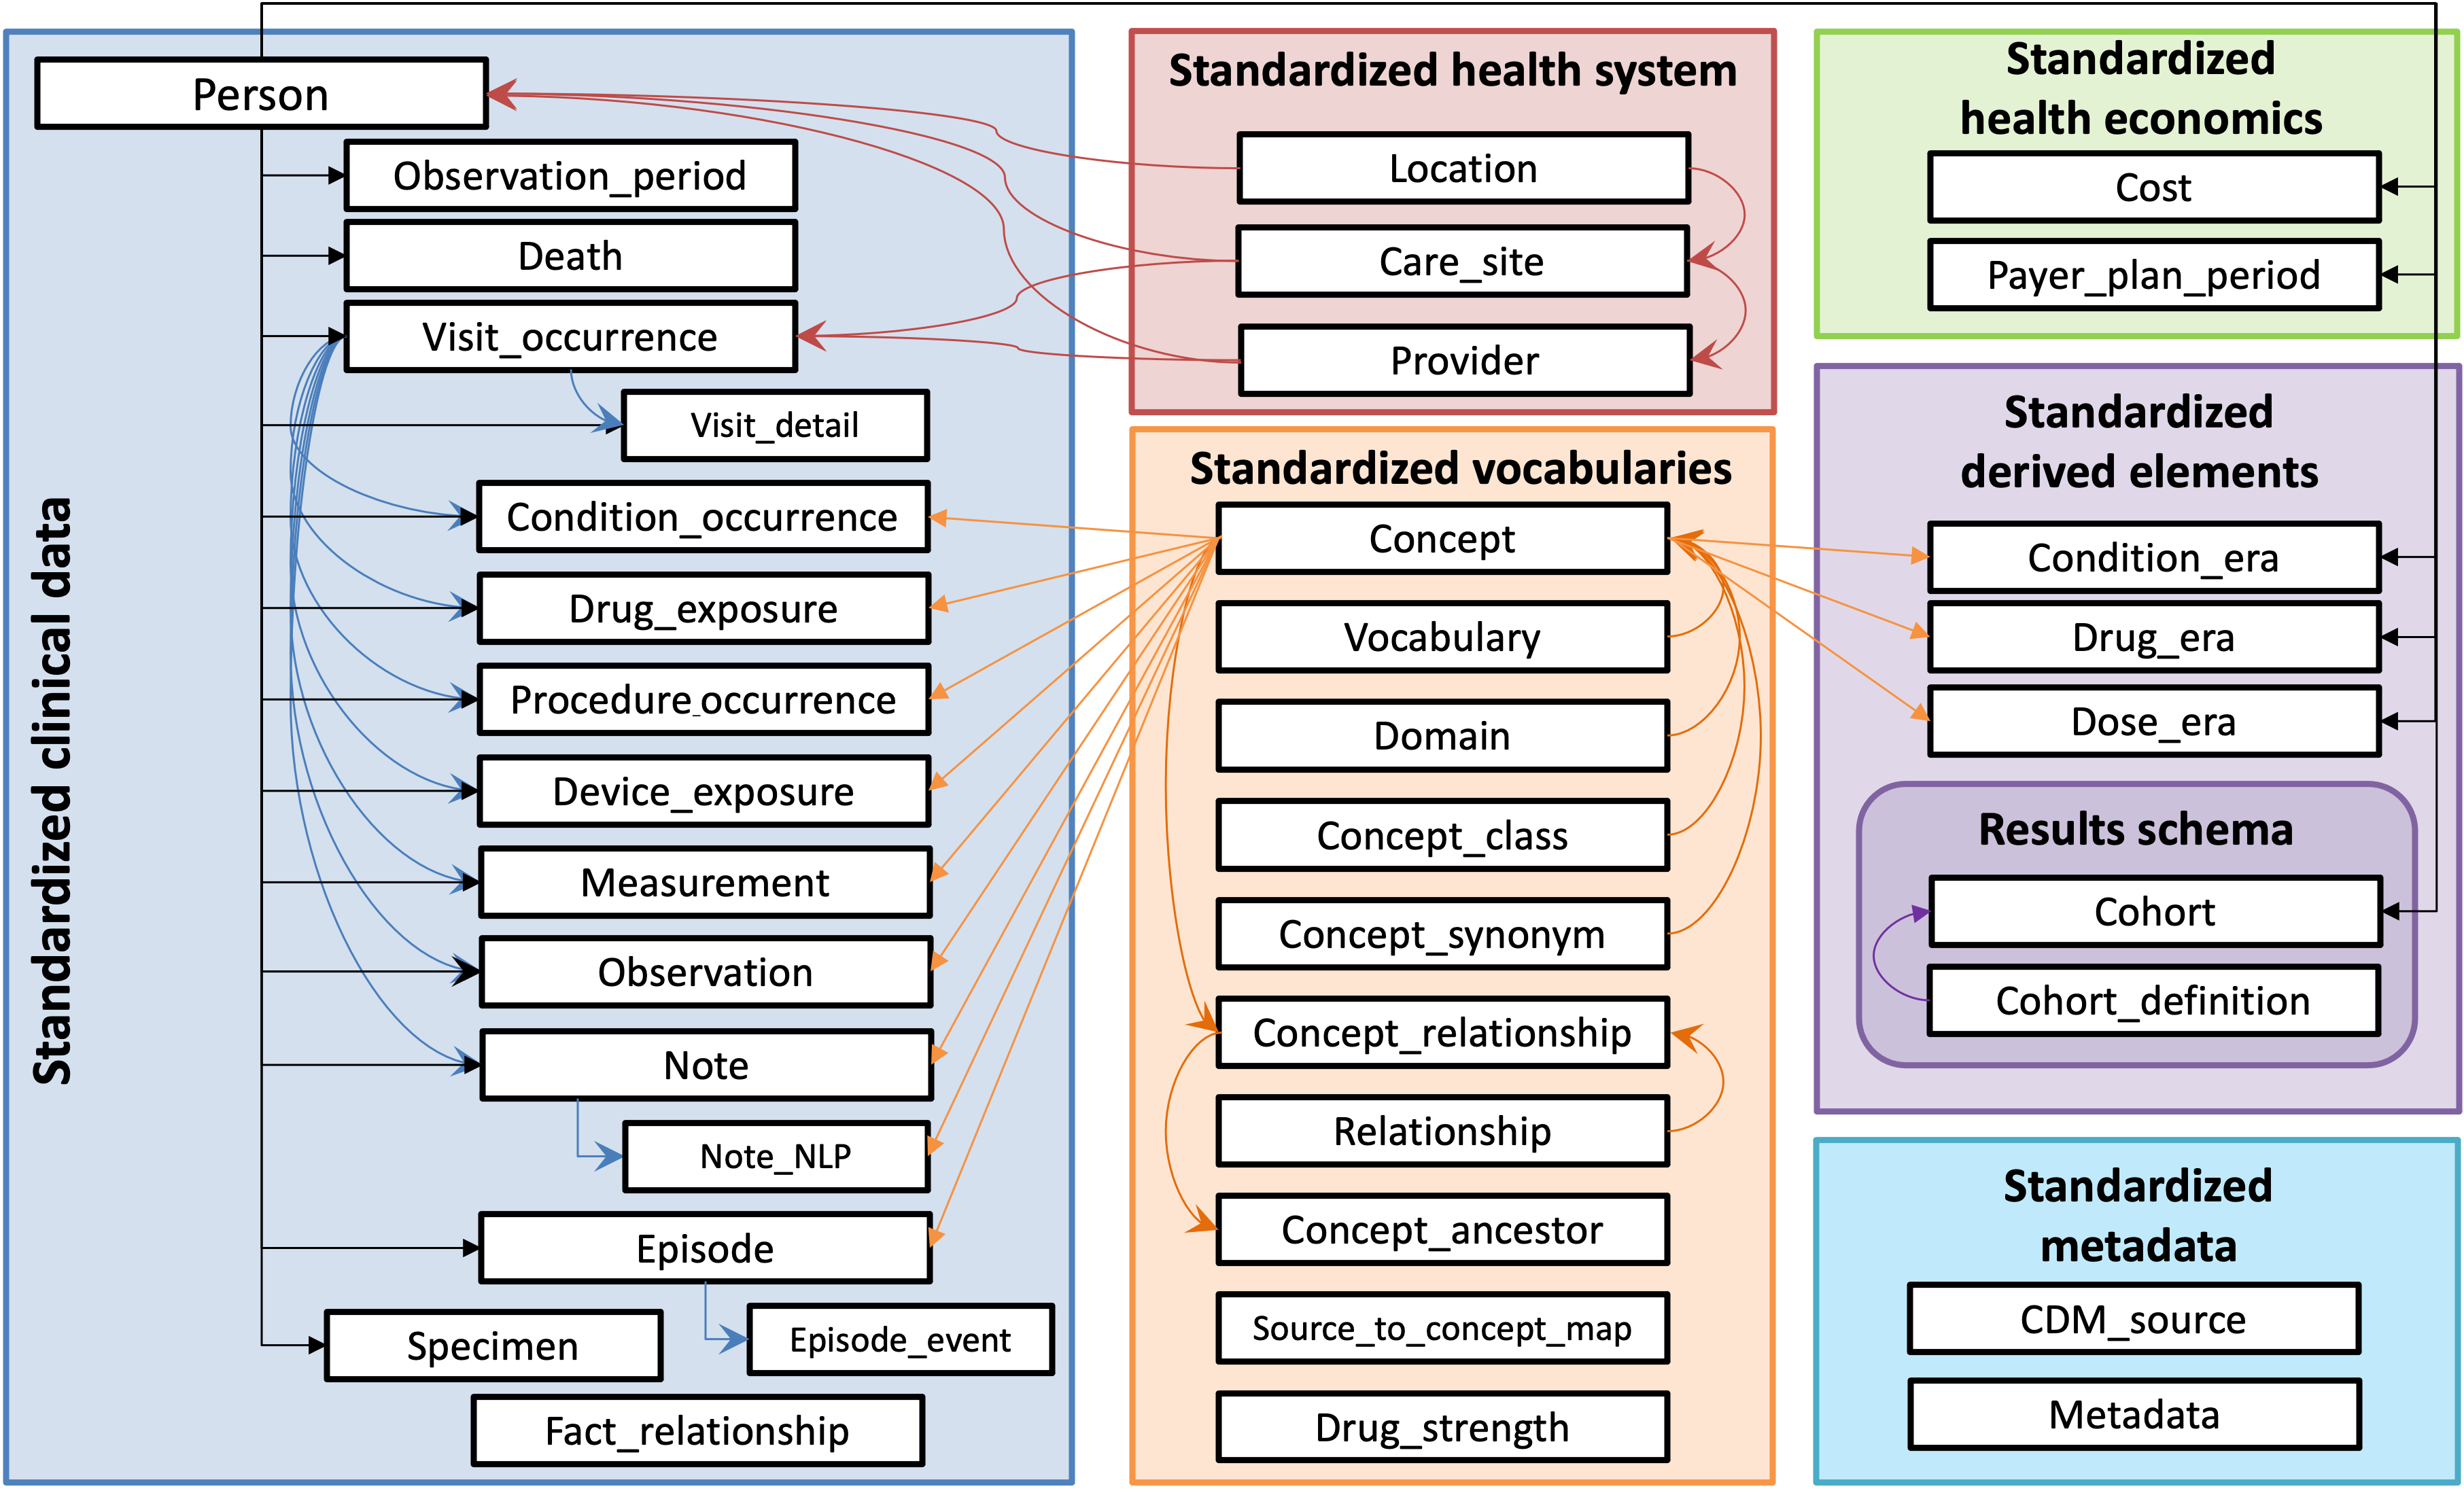
The Observational Medical Outcomes Partnership Common Data Model (OMOP CDM) is a standardized framework for organizing and analyzing observational healthcare data. The OMOP CDM converts diverse sources of health data into a common format that supports large-scale, systematic analysis.
The OMOP CDM organizes data into a consistent set of relational tables like condition_occurrence, drug_exposure, person, visit_occurrence etc, using standardized vocabularies. These tables are interconnected, allowing for relational analysis across a patient’s medical history.
By transforming diverse healthcare datasets into a common format, the OMOP CDM enables reproducibility, interoperability, and large-scale studies across institutions and populations.
What is Patient-Level Prediction (PLP)?
Patient-Level Prediction (PLP) is a data-driven approach that uses machine learning or statistical models to estimate the risk of specific clinical outcomes for individual patients, based on their historical healthcare data.
The key goal of PLP is to answer personalized clinical questions like:
“For patients who present with chest pain leading to a hospital visit, can we predict which of these patients will go on to experience a heart attack after their hospital visit?”
PLP focuses on using observational patient data such as diagnoses, medications, procedures, and demographics - to predict individual-level risks of future health events. While it may sound similar to precision medicine, there’s a key distinction: precision medicine aims to tailor treatment plans based on a patient’s genetics, environment, and lifestyle, whereas PLP is specifically about forecasting outcomes for individual patients using data-driven models. These predictions can support timely and personalized clinical decisions.
Why PLP in Julia?
While established PLP workflows are well-supported in R through OHDSI’s suite of packages, our work explores an alternative approach using Julia - a high-performance language that enables building efficient and reproducible pipelines from end to end.
Julia offers several advantages that make it well-suited for observational health research:
Composability: Julia’s modular design supports reusable components, making PLP pipelines easier to maintain and extend.
Speed: With performance comparable to C, Julia efficiently handles large, complex healthcare datasets.
Unified Ecosystem: Tools like
OHDSICohortExpressions.jl,DataFrames.jl,MLJ.jletc. integrate seamlessly, enabling cohort definition, data transformation, and modeling within one consistent environment.
Additionally, Julia features a rich and growing ecosystem with many tools for scientific computing and data science, making it a strong alternative for modern health informatics workflows.

Reference: Foundation from the OHDSI PLP Framework
Throughout the development of this PLP pipeline, I referenced the methodology presented in the following paper:
Reps, J. M., Schuemie, M. J., Suchard, M. A., Ryan, P. B., Rijnbeek, P. R., & Madigan, D. (2018). Design and implementation of a standardized framework to generate and evaluate patient-level prediction models using observational healthcare data. Journal of the American Medical Informatics Association, 25(8), 969–975. https://doi.org/10.1093/jamia/ocy032
This paper laid the groundwork for my implementation and inspired several core components of the project — from data curation to model evaluation.
Methodologies from the Paper
Standardized Framework for PLP - Outlines a consistent process for building patient-level prediction models across datasets and settings.
Defining the Prediction Problem - Emphasizes clear definition of target, outcome, and time-at-risk for valid predictions.
Cohort Definition and Data Extraction - Uses standardized OMOP CDM cohorts to ensure reproducibility and consistent data extraction.
Feature Construction - Derives meaningful predictors from observational data like conditions and demographics.
Model Training and Evaluation - Trains ML models and evaluates them using metrics like AUC and cross-validation.
We are adapting this framework for our PLP pipeline to ensure a consistent approach.
Research Question
As an example, here is one question we could potentially explore within this PLP pipeline:
Among patients diagnosed with hypertension, who will go on to develop diabetes?
The focus is on identifying patients with hypertension who may progress to diabetes based on their medical history and risk factors.
Cohort Construction
Cohorts are groups of patients defined by specific criteria that are relevant to the research question. For this task, two main cohorts need to be defined:
Target Cohort: This refers to the group of patients we want to make predictions for. In our case, it includes patients who have been diagnosed with hypertension. These patients serve as the starting point for our prediction timeline.
Outcome Cohort: This refers to the clinical event we aim to predict. In our case, it includes patients from the target cohort who are subsequently diagnosed with diabetes within a specified time window. This event marks the outcome that our model will learn to forecast.
These cohort definitions are central to structuring the data pipeline, as they form the foundation for downstream tasks like feature extraction, model training, and evaluation.
Defining Cohorts using OHDSICohortExpressions.jl
In the context of this research, I received a 20GB synthetic dataset that contains 1,115,000 fake patients (1,000,000 alive and 115,000 deceased), each with 3 years of medical history. This dataset was provided as a DuckDB database, a lightweight, high-performance analytical database that allows fast querying of large datasets directly from local files without the need for a server. For more details on how to use DuckDB with Julia, refer to the DuckDB Julia Client Documentation.
For cohort creation, I used OHDSI cohort definitions provided directly by my mentor in the form of two JSON files:
- Target cohort:
Hypertension.json - Outcome cohort:
Diabetes.json
To execute them, I used the OHDSICohortExpressions to convert the JSON definitions into SQL queries, which were then run against the DuckDB database to extract the relevant cohorts.
Here’s the breakdown of the process:
Reading the cohort definitions from JSON files.
Connecting to the DuckDB database, which stores the synthetic patient data.
Translating the cohort definitions into SQL using OHDSICohortExpressions.jl.
Executing the SQL queries to create the target and outcome cohorts in the database.
Cohort Definition Code
Here’s how we set up the DuckDB connection and define cohorts using OHDSI JSON definitions:
File: cohort_definition.jl
import DBInterface: connect, execute
import FunSQL: reflect, render
import OHDSICohortExpressions: translate
using DuckDB, DataFrames

# We use DrWatson.jl to manage project-relative paths using `datadir(...)`
# This ensures portable and reproducible file access within the project

# Read the cohort definitions from JSON files (Hypertension and Diabetes definitions)
target_json = read(datadir("exp_raw", "definitions", "Hypertension.json"), String)  # Target cohort (Hypertension)
outcome_json = read(datadir("exp_raw", "definitions", "Diabetes.json"), String)  # Outcome cohort (Diabetes)

# Establish a connection to the DuckDB database
connection = connect(DuckDB.DB, datadir("exp_raw", "synthea_1M_3YR.duckdb"))

# Function to process a cohort definition (translate the JSON to SQL and execute)
function process_cohort(def_json, def_id, conn)
  catalog = reflect(conn; schema="dbt_synthea_dev", dialect=:duckdb)  # Reflect the database schema
  fun_sql = translate(def_json; cohort_definition_id=def_id)  # Translate the JSON to SQL query
  sql = render(catalog, fun_sql)  # Render the SQL query

  # Ensure the cohort table exists before inserting
  execute(conn, """
  CREATE TABLE IF NOT EXISTS dbt_synthea_dev.cohort (
    cohort_definition_id INTEGER,
    subject_id INTEGER,
    cohort_start_date DATE,
    cohort_end_date DATE
  );
  """)

  # Execute the SQL query to insert cohort data into the database
  execute(conn, """
  INSERT INTO dbt_synthea_dev.cohort
  SELECT * FROM ($sql) AS foo;
  """)
end

# Process the target and outcome cohorts
process_cohort(target_json, 1, connection)  # Define the target cohort (Hypertension)
process_cohort(outcome_json, 2, connection)  # Define the outcome cohort (Diabetes)

close!(connection)
This code uses FunSQL.jl and OHDSICohortExpressions.jl to translate and render OHDSI ATLAS cohort definitions into executable SQL for DuckDB. The translate function from OHDSICohortExpressions.jl converts the JSON cohort definitions (Hypertension and Diabetes) into a FunSQL query representation. Then, reflect is used to introspect the DuckDB schema, and render from FunSQL.jl turns the abstract query into valid DuckDB SQL. The process_cohort function executes this SQL using execute to insert the resulting cohort data into the cohort table. This pipeline allows OHDSI cohort logic to be ported directly into a Julia workflow without relying on external OHDSI R tools.
Wrapping Up
This post covered the foundations of the PLP pipeline:
Explored observational health research, OMOP CDM, PLP, and Julia for large-scale clinical data analysis.
Formulated the research question: predicting diabetes progression in hypertension patients.
Explained OMOP CDM’s role in standardizing clinical data.
Defined target and outcome cohorts for the study.
Used Julia to convert cohort definitions into executable SQL for DuckDB querying.
In the next post, I’ll walk through how we go from raw clinical data to predictive modeling, with Julia code examples that highlight feature extraction, data processing, and model training-bringing the full PLP pipeline to life.
Acknowledgements
Thanks to Jacob Zelko for his mentorship, clarity, and constant feedback throughout the project. I also thank the JuliaHealth community for building an ecosystem where composable science can thrive.
Jacob S. Zelko: aka, TheCedarPrince
Note: This blog post was drafted with the assistance of LLM technologies to support grammar, clarity and structure.
Citation
@online{lakshmi_indu2025,
  author = {Lakshmi Indu, Kosuri},
  title = {PLP-Pipeline {Series} {Part} 1: {From} {Research} {Question}
    to {Cohort} {Construction}},
  date = {2025-04-12},
  langid = {en}
}